Earlier this week, I had one of those business trips where–right
after landing in Washington, DC before even leaving the airport–I checked in
for my flight home. So, I was destined to spend even less time in Washington
than a typical West Wing staffer.
The purpose of my trip was to attend the initial meeting of
the Motorcyclist Advisory Council, a 10-member committee assembled by the
Federal Highway Administration, and charged with presenting recommendations to
the Administrator on infrastructure issues of concern to motorcyclists. This is
a broad remit, covering everything from the design of road barriers to
V2V and other ITS technology.
One of the first presentations was essentially a statement
of the problem: Motorcycles account for an increasingly disproportionate share
of all road fatalities. While we account for less than 1% of all Vehicle-Miles
Traveled, we make up over 14% of all road fatalities.
This presentation was made by MAC member Chanyoung Lee, who
is on the faculty of the Center for Urban Transportation Research at the
University of South Florida. What follows are my own comments, based on Dr. Lee’s
talking points.
Even at a glance, you can see that it’s not really as simple
as, “Car deaths are decreasing, but motorcycle deaths are increasing.” Both car
and motorcycle deaths have been holding relatively stable so far in this
decade. But let’s look at a few interesting spots on this graph...
1–Sharply rising deaths in the late ’70s
Deaths rose sharply in this period, perhaps influenced by a
double-whammy of widespread helmet-law repeals in the middle of the decade,
followed by a gasoline price spike (which, at least anecdotally, is associated
with people commuting on fuel efficient motorcycles.)
2–This trough in the ’90s tracks with a period of very slow
sales
Deaths dropped to into the low 2000s in the ’90s. More than
anything else, this likely reflects the fact that throughout that decade, only
about a quarter of a million new bikes were sold per year in the U.S. Fewer
new-bike sales isn’t a perfect analog for the number of new (read: most
at-risk) riders, but it’s the best corollary that I have at my fingertips.
Between the late ’90s and the 2008 crash, however, we make up for lost time by
killing ourselves in sharply increasing numbers. This curve tracks almost
perfectly with new bike sales.
3–Car fatalities level off. Or do they?
From the early ’90s until the mid-2000s, it looks as if car
deaths have leveled off. But in fact, this is a period in which autos become a
lot safer. The key to understanding these numbers is to realize that what
matters is the rate of death per vehicle-mile traveled (VMT). According to the
FHWA, Americans logged about 2.25 trillion VMT in 1992. That number increased
to over 3 trillion VMT by 2007. Auto makers likely deserve most of the credit
for holding fatalities largely steady.
4–The recession hurt undertakers too, I guess
The sudden drop in motorcycle fatalities after 2007 is
explained by an even more dramatic drop in new bike sales, from a peak of about
1,125,000 in 2007 to barely half a million in 2009. Meanwhile, if auto makers
could be proud of holding deaths constant in spite of the fact people drove
more through the ’90s, they can bust their buttons over the long and impressive
drop in auto fatalities from the early ’aughts to the early ’teens. Widespread
adoption of advanced safety features like airbags and ABS. The real question is, as dangerous old cars
continue to age out of the total fleet, why hasn’t this trend continued? More
on this later.
This photo’s a tad underexposed; sorry. The blue bars are
deaths of riders under 29, the red bars are riders 30-49, and the green bars
are riders over 50.
5–“Every new motorcycle sold with FREE body bag”
From the late ’70s through the early ’80s, the vast majority
of deaths are young riders. At a glance, all the red bars appear about the same
from the late ’70s until the mid-’90s. And those little green caps, indicating
deaths of riders over 50, seem both constant and trivial.
6–When sales crash, riders don’t
The sales crash of the 1990s corresponds with a drop in
young rider fatalities, but no apparent drop in older, and presumably more
experienced, rider deaths.
7–“Let’s blame the old guys”
From the early ’aughts until now, younger rider deaths have
held roughly steady (that slight rise in the early-to-mid ’aughts tracks
perfectly with the last heyday of supersports-class sales.) Meanwhile deaths of
over-50 riders have increased significantly. The easy conclusion: Suddenly
there’s a bunch of crotchety old farts who can’t admit they should stop riding;
they’re a hazard to themselves. But it’s not that simple, as the next graph’s
open to at least two very different interpretations...

This graph looks at the number of fatalities by age of
rider. The blue line compiles rider deaths in the 2003-’05 period, while the
red line compiles deaths in the 2013-’15 period. It is a pretty cool
visualization if you’re into stats, and it looks like the final proof for the
doddering-old-fool theory of increased motorcycle fatality. Because, the two
lines look remarkably similar but the later stats are all pushed to the right. But–and
if you know me at all, this will come as no surprise–that’s not how I read it.
Are more older riders dying? Of course. But this graph provides no evidence
they’re dying because they’re older.
8–It’s 2013. Do you know where your kids are?
Not if you’re a motorcycle dealer. And that very steep rise
between riders in their late teens and those in their early twenties simply
reflects the fact that your first couple of years on a full-power motorcycle
are as dangerous than all the subsequent ones.
The shift in very young fatalities is visible–those early
deaths peaked at 21 in the early ’aughts, but at around 24 a decade later. But
the rightward/older shift’s nowhere near as dramatic as it is amongst older
cohorts. This shift almost certainly reflects something anyone in the business
knows intuitively; there are fewer really young riders out there.
9–The early ’aughts seemed to have been a dangerous time for
30- and 40-somethings
That’s weird, eh? Or is it?..
10–Anyone in the motorcycle business between 2003-’13 knew
buyers were getting older
Look at those two peaks: the blue peak by 9 and the red peak
by 10. In the decade that separates these two sets of statistics, the average
age of a motorcycle buyer increased by about a year with each passing year. All
that rightward shift really means is that in 2013 when someone said, “Fifty is
the new 40” they were right, at least where motorcycle buyers were concerned.
In fact, those two peaks are actually comprised of the very
same cohort, seen ten years apart.
11–It’s easy to look at that red line shift and say, “Obviously,
older riders are crashing more,” but you could only draw that conclusion if you
had access to numbers no one has ever seen: motorcycle VMT by rider age–information
that is not available as far as I know.
Anecdotal, I admit; but I am pretty confident that the
larger number of older-rider fatalities reflects a far larger number of older
riders, including older novices and/or riders returning after gaps so long they
might as well be novices.
Look at the way the lines appear to converge for riders in
their mid- to late-60s. If my gut instinct is correct, and there are a lot more
riders in this cohort now, it suggests that today’s older riders are as safe as
they ever were. Personally I suspect that at least where motorcycle safety’s
concerned, seventy really is the new sixty.
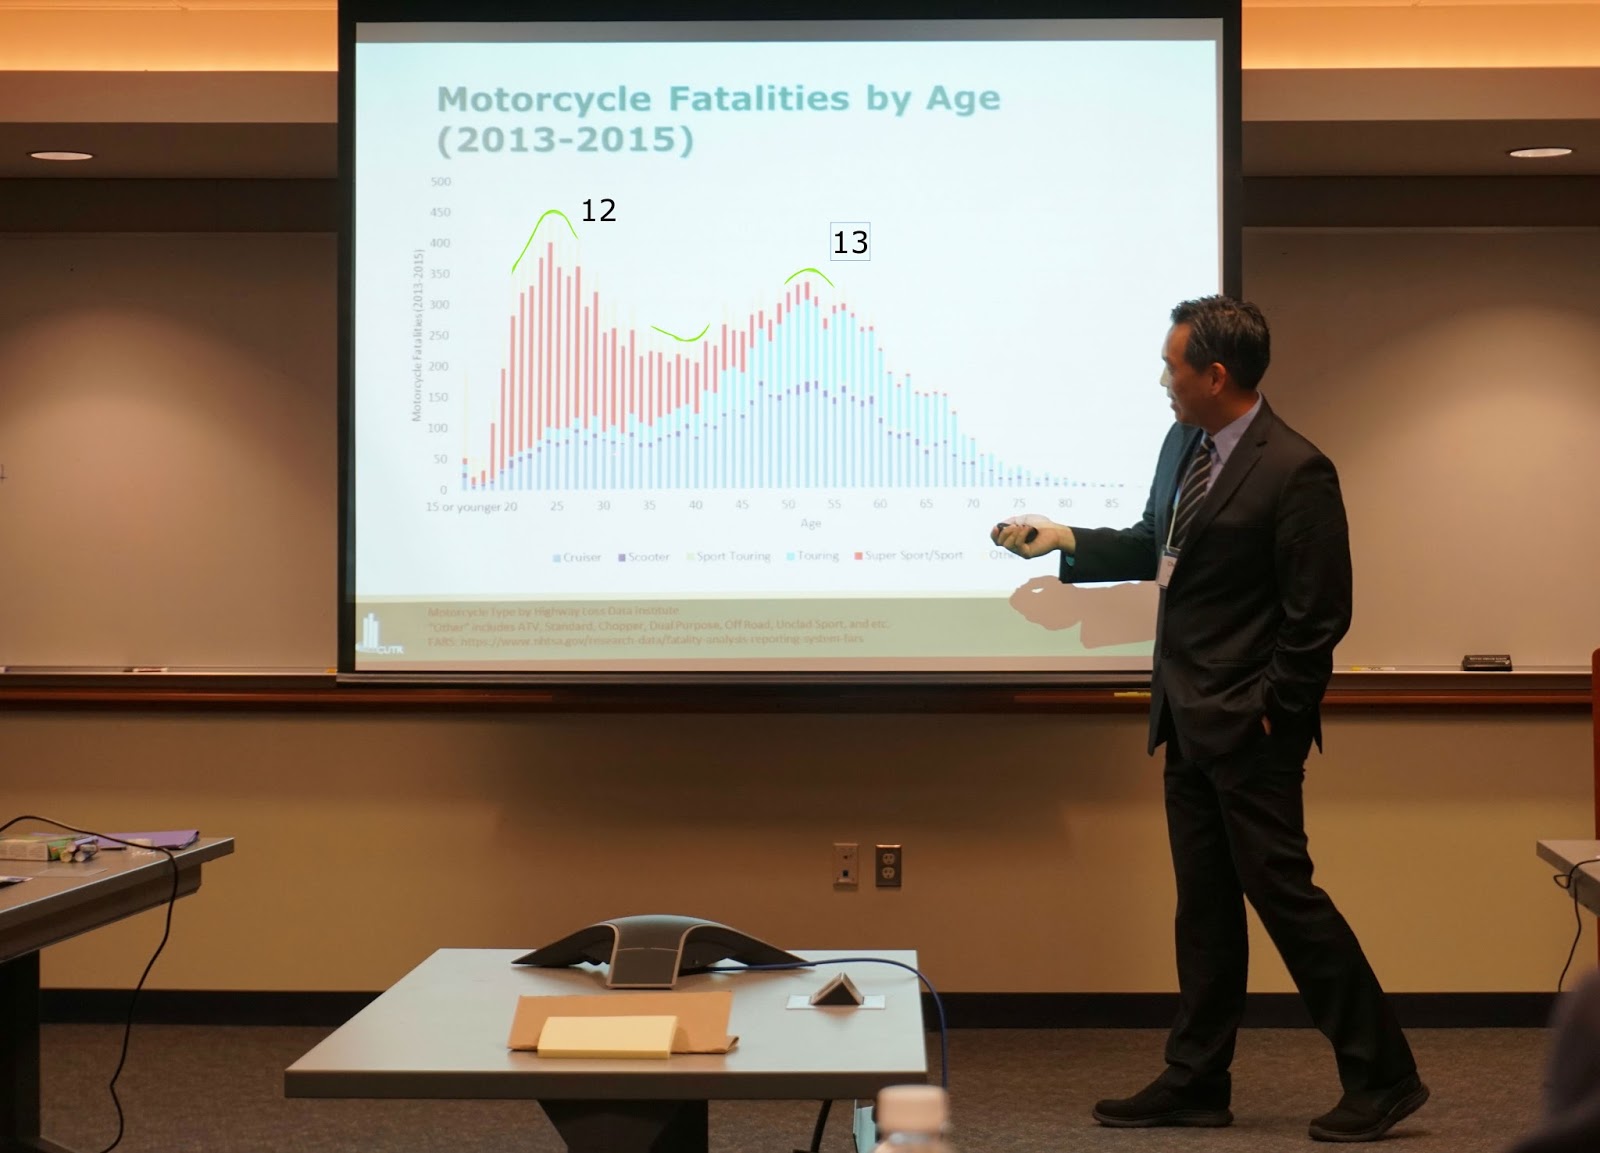
This graph compiles three years of fatalities, from FARS
data for 2013/’14/’15, broken down by motorcycle type. Sorry, but the exposure
on this photo barely captures the ‘Other’ category of motorcycles, which
includes everything from Naked/Standard to Dual Sport to MX bikes ridden on the
street. I hand-drew lines capturing the other data at peaks and troughs.
12–Everything their moms told them about motorcycles was
true
That huge red bulge indicates the scale of carnage, when it
comes to twenty-somethings on crotch rockets. The single most dangerous age
appears to be 24; that cohort racked up around 450 fatalities. That’s a lot,
but it’s even more striking when you realize the sport bike market is in the
toilet and the whole U.S. motorcycle industry currently bemoans the lack of
20-somethings shopping on dealer floors.
13–One way to avoid running out of money in retirement
The second big bulge is comprised of riders in their 50s to
early 60s, on cruisers and touring bikes. 52 year-olds topped off at about 360
deaths. The tailing-off of the red zone probably indicates that by the time you
hit 60, you’re not riding sport bikes any more–although it could also mean that
if you still ride sport bikes at that age, you’re more skilled and/or careful.
The bulge in deaths of middle-aged riders wouldn’t even be
noticeable except for one thing: the corresponding dip in fatalities amongst
thirty-somethings. Only about 260 people in the cohort of 37 year-olds died in
motorcycle crashes. It’s easy to conclude that by the time riders hit their
50s, they’re 40% more likely to kill themselves than they were 20 years
earlier. But I’m pretty sure that’s not true. There are a number of factors
that could skew deaths by riders in their mid-30s lower. That’s a prime age to
be married with children, which is a time of life that many people stop riding.
My suspicion is that this graph would really benefit from
some additional information, looking at VMT by each cohort. I’m pretty sure
that the first bulge would seem even more significant, while the second would
seem less so. What I want to know, before concluding that “the problem is all
these old riders” is, what is the number of miles traveled per fatality?
 |
| "Will Monsieur be dying alone tonight?" Asked the Maitre d'Hotel. |
Last but not least, this graph shows the ratio of
single-vehicle crashes in blue, compared to crashes involving other moving
vehicles (red). Each bar represents a year, between 1981-2015.
Not surprisingly, the ratio is remarkably constant. Between
40% and 45% of fatal crashes are single-vehicle crashes. You might just be able
to see the arrival of the first real race-rep supersports bikes on this graph,
in the form of a few years of rising single-vehicle fatalities in the late ’80s.
14–Hit me up. Or not.
The consistency of this graph makes the five-year slope from
2011-’15 look significant. For five straight years, the share of fatalities
involving another vehicle increased. Is this the ‘distracted driver’ effect?
That wouldn’t surprise me.
One way to change the single:multiple-vehicle ratio that
much, would be to add about 200 fatalities to the multiple-vehicle tally. An
extra 200 fatal crashes attributed to distracted driving, would mean a significant
share of responsibility for the “rising death rate among motorcyclists” was
actually car drivers’ fault.
In conclusion...
There was one moment at the MAC meeting when someone looked
at the period in the mid-’90s when motorcycle fatalities were half what they
are today, and said, “So you see, we can cut motorcycle fatalities in half,
because we’ve done it before,” and pointed to that area I labeled '6' above. That’s not a
solution the motorcycle industry wants to endorse, because it was a period of
dreadful motorcycle sales.
 |
| 15–Going back to what worked in the mid-'90s is not a safety solution the U.S. motorcycle industry can endorse. |
There have been times in the past when rising motorcycle
death rates almost certainly were attributable to rising sales–in particular to
new riders (or riders returning after a very long gap.) There is a wealth of
data from the insurance industry that confirms the extreme risk to new riders;
particularly new riders on sport bikes and/or riders in their first month. Many
if not most new-rider training programs have been proved ineffective when it
comes to reducing accident and death rates.
By contrast and unsurprisingly, the longer you ride without
killing yourself, the less likely you are to kill yourself riding. Is there a
limit to that observation? Of course; at some point, as we age, the time comes
to hang up the helmet. But an analysis of current FARS data, etc., without
information about VMT by those ‘danger-to-themselves’ fifty-somethings, must be
seen as speculation. I’m old, so I’m a selective filter for old friends; I
admit that, but I’m also certain that the people I know who rack up the most
yearly mileage are in that 50+ age bracket.
What the motorcycle industry needs is some way to bring in
noobs without exposing them to unnecessary risk. That’s a topic for a different
post.
If you've read this far, you must feel that you got something out of this long post. I spent hundreds of dollars traveling to Washington, and writing it took a significant amount of time and brain power. Want to throw a little something my way? I've never asked for a donation (and don't even have a means to accept one on this site) but if you want to reward me, buy this book. It's cheap and funny, and makes a terrific gift for any motorcyclist.
Note that the most recent NHTSA Fatality Analysis Reporting
System (FARS) data suggests that in 2016 there were 5,286 motorcycle fatalities
(out of 37,461 total) but that in some of these graphs, Dr. Lee used numbers
provided by the Insurance Institute for Highway Safety, so they don’t
necessarily add up exactly correctly. Any differences are statistically trivial,
both databases appear to show the same trends.